
how to measure serendipity online | lab notes #5
towards metrics for online community health


The real treasure is the friends we made along the way
This post is written primarily by Alexandre
How can we tell if an online community is thriving?
In a previous post, we shared our vision of building exoskeletons for online communities.
To be successful, we need a way to determine whether the intervention we implement is helping the community flourish or, instead, hindering its movements.
The kind of metrics we are looking for is less like a “KPI to blindly maximize”, and more like “a diverse set of biomarkers to understand the health of different parts of an ecosystem”.
To make the research more actionable, we decided to frame the target on measuring serendipity. Can we count all the events, friendships, and projects that started organically without anybody planning ahead?
We are excited for the applications of serendipity metrics for community power-users like event organizers. Could we learn which types of events are best suited to create new friendships? Can we find how the algorithm change influences the social fabric, and organize counter-movements to patch the holes?
In this lab note, we present preliminary results on trying to measure the social activity of the users from the Community Archive. We ran two mini-studies: i) a quantitative analysis of how many alive relationships users maintain over time, and ii) a qualitative analysis of how Twitter relationships start.
In short, we found:
There seem to be significant macro-trends in the evolution of the number of alive relationships per user, like a sharp increase in relations per user after Vibecamp 2. The observation is robust over different choices of metrics and user subsets, which suggests our metrics are tracking something real.
The majority of Twitter connections start when one user resonates with another user’s content, writes a thoughtful reply, and initiates a back-and-forth dialogue that carries over to other threads. There are a few cases of members meeting at in-person events like Vibecamp, but this is not frequent enough to be significant, from what we can see from the tweets.
Let’s dig into the analyses!
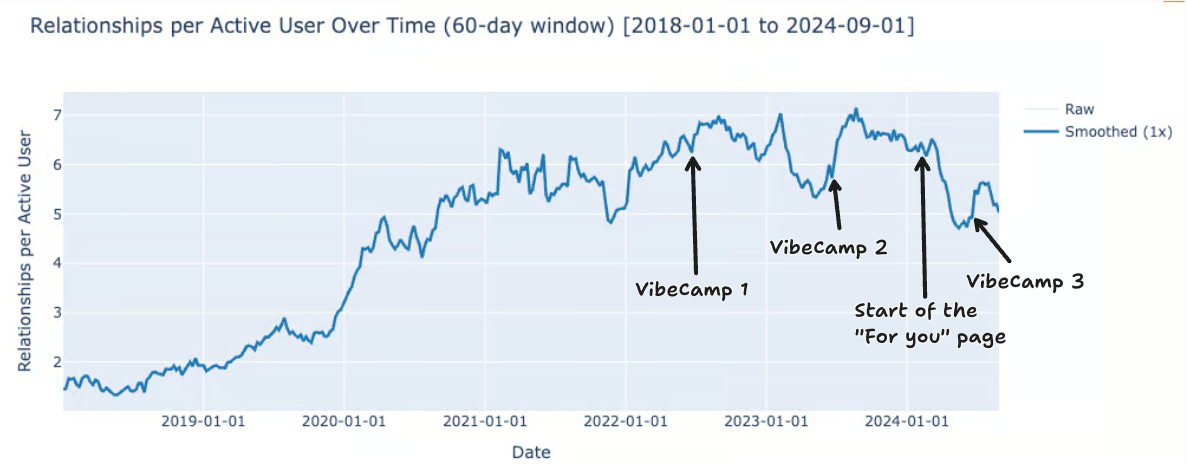
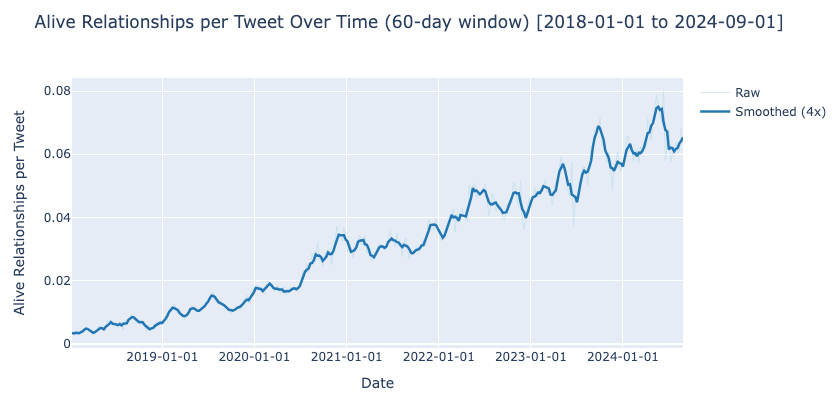
Graph of bidirectional relationships alive per user over time. Significant community and platform events correlate neatly with the data.
Candidates for a social aliveness metric
What makes a relationship? Ideally, we’d like to count the number of warm social connections per person. We think that connections are a primary channel of serendipity, through which new projects start, events happen, insight gets created, or new friendships start!
For the “warm” part, we use recent exchange as a proxy for “closeness”, and compute all our metrics for a given time window (we used 2 months over the analysis). For the “connection” part, we filtered out parasocial relationships by looking at bi-directional relationships.
However, we only have partial visibility over bidirectional relationships. We only see the tweets from people who uploaded their archive to the community archive. If a member of the CA is having long chains of replies with someone who is not in the CA, this will show up in our data as a series of tweets sent without any replies. In practice, our bidirectional metrics measure bidirectional pairs where both users uploaded to the CA.
To fill this gap, we use the reply relationships, so tweet exchanges above a threshold would always appear, even if a user from the pair is not in the CA. We lose the bidirectionality, but we track better the total number of relationships users maintain.
Having two metrics is also a great way to make our analysis more robust.
We implemented the two metrics with the following formulas. Within a time window (we used 2 months over the analysis), we computed:
Bidirectional relationships. Pairs or users where user A replied to user B at least once AND user B replied to user A at least once in the time window. One such pair counts for 2 relationships. To interpret this correctly, keep in mind that both A and B need to be in the community archive for the relationship to show up.
Reply relationships. User A replied to user B more than K times in the time window (we used K=1 and K=5 in the rest of the note).
We narrowed down the analysis to the period from January 2018 to September 2024. Before January 2018, there were so few active users that the community didn’t really exist yet. September 2024 is the beginning of the community archive. So we know that before this date, we have an exhaustive record of the members who did upload. Unfortunately, we don’t have access to the last year of analysis, as most people who uploaded their archive in September didn’t refresh it after. We have the real-time flow of tweets coming from the web browser extension, but it’s not enough to patch the gaps.
Number of relationships
This is what the number of relationships looks like over this time period:
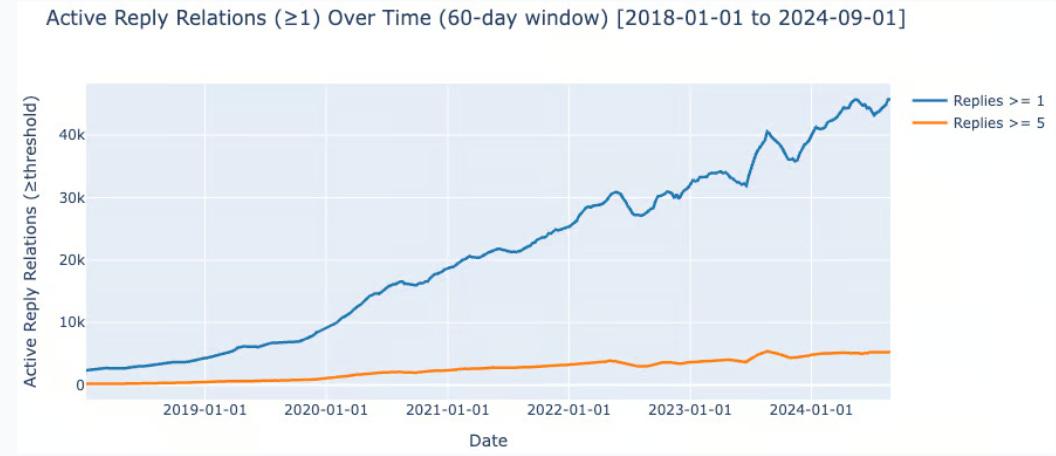
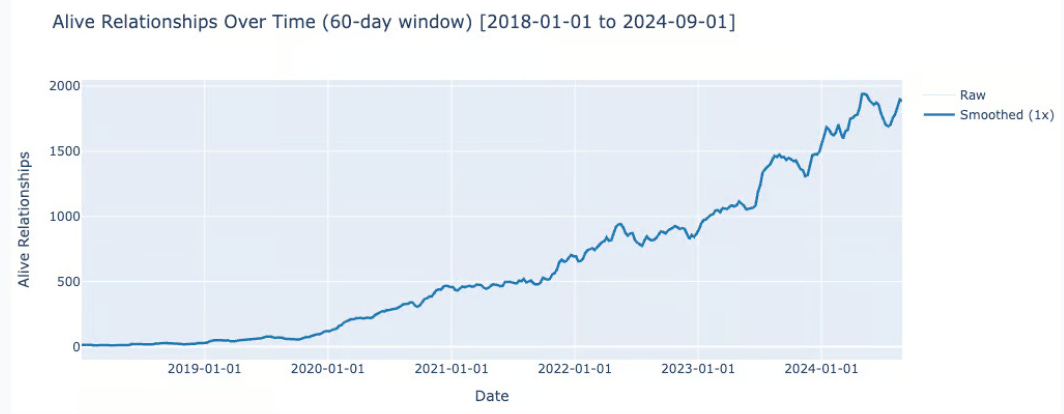
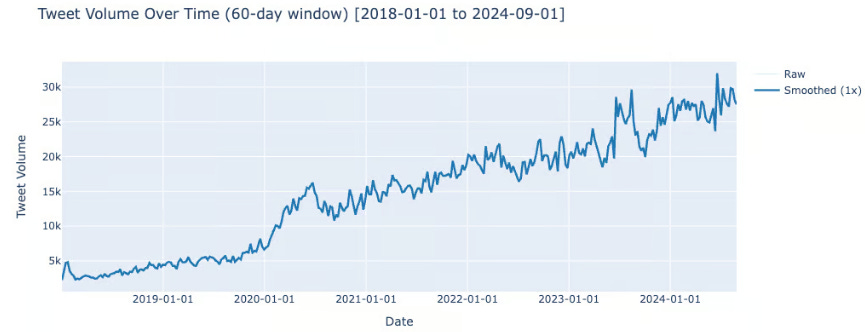
According to all the metrics, the number of relationships alive exploded over the 6 years of the analysis. Interestingly, the number of relationships seems to have exploded faster than the raw number of tweets over the same period:
Bidirectional relationships: 180x from 10 to 1800
Reply relationships: 10x from 2.2k to 21.5k (K=1) and 11x from 230 to 2.7k (K=5)
Tweet volume: x7 increase from 4k to 28k
The dramatic increase in bidirectional relationships comes from the fact that they need both users to be in the CA. As the number of relationships grew, the proportion of relationships within the CA grew too. The bidirectional relationships grew as a result of these two trends.
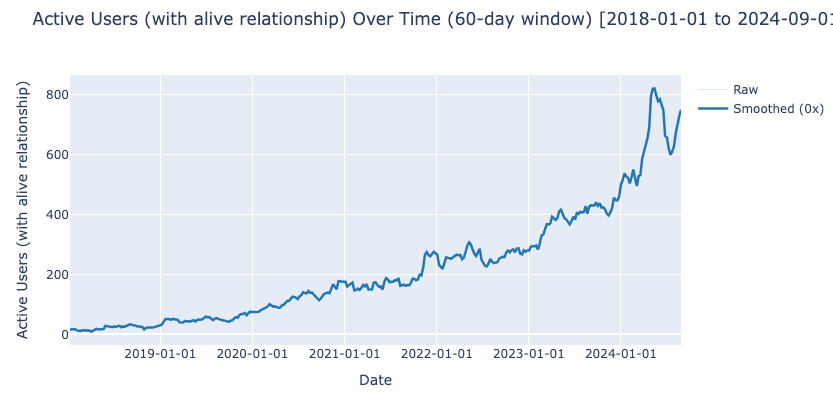
Relationships per active users
The number of relationships grows, yay! But the number of active users grows, too. What we really want is the number of relationships per active users, i.e., per users that have at least one relationship. (We also include the plots for the number of relationships per tweet and the total number of users in the Appendix).
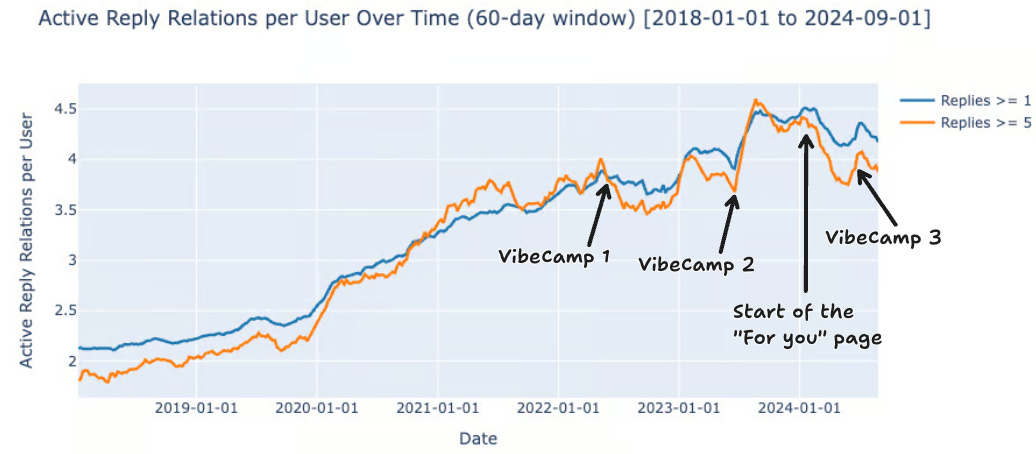
We added the dates of Vibecamp editions on the plots, with the dates found from a Perplexity search (not 100% confident).
June 17-20, 2022
June 15-18, 2023
June 13-16, 2024
We can spot some consistent trends across the metrics. The most consistent is the rapid growth in relationships precisely after Vibecamp 2. The date of the event corresponds exactly to the little dent in the bidirectional relationship, and the dip in both plots for the reply relationships. This suggests that the people who met at the event became online connections in the following months.
Other trends are harder to explain. What caused the dip in relationships from January 2023 to Vibecamp 2? From February 2024 to Vibecamp 3 (clearly visible for all metrics)? Are there changes in the algorithm that would correlate with these dates?
The For You page appeared in January 2024 (shown on the graphs). It could be the reason for a drop in relationships, as people stopped seeing as many tweets from people they follow, and instead were shown tweets from outside their social circles.
Sensitivity analysis
As expected, the number of relationships per user is a fat-tailed distribution. A few users concentrate on a large number of relationships.
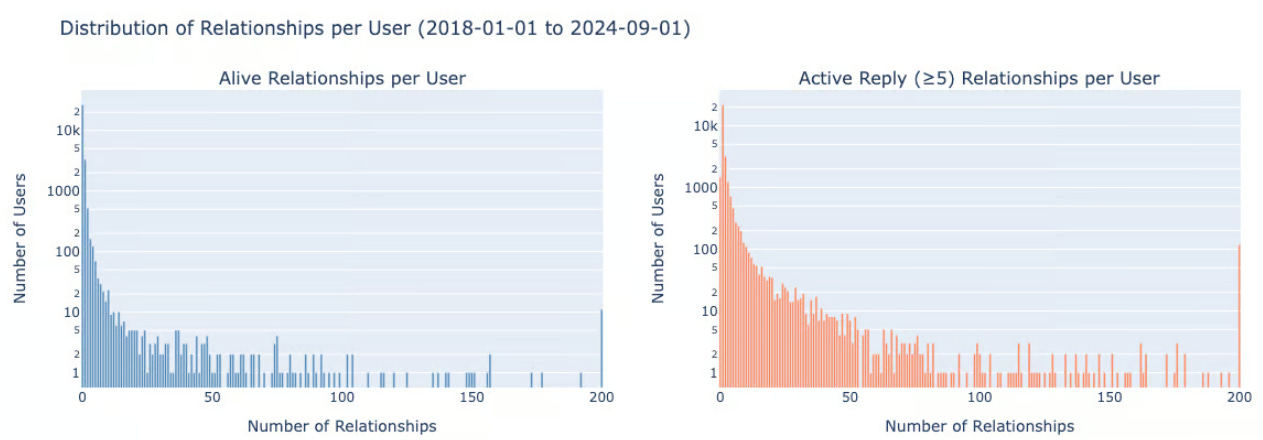
Distribution of relationships per user, with a 6-year time window and log y-axis. The datapoints with > 200 relationships are added to the last bar.
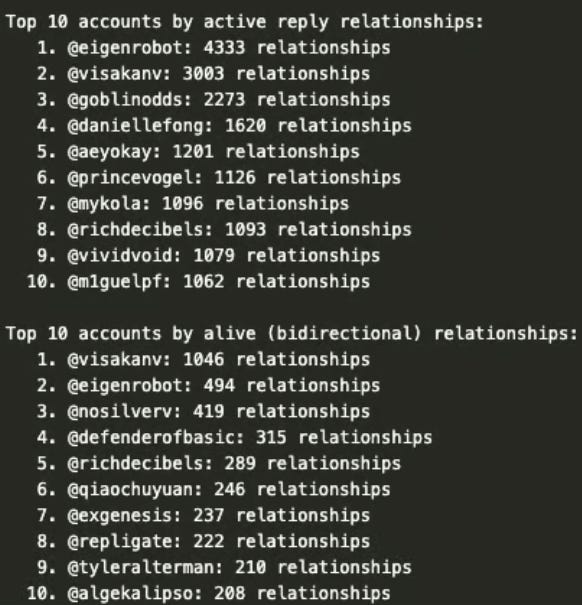
Here are the top ten accounts for the bidirectional relations and the reply relations (threshold of 5).
After removing the top 10 users, we observe a drop in the average relationships per active user.
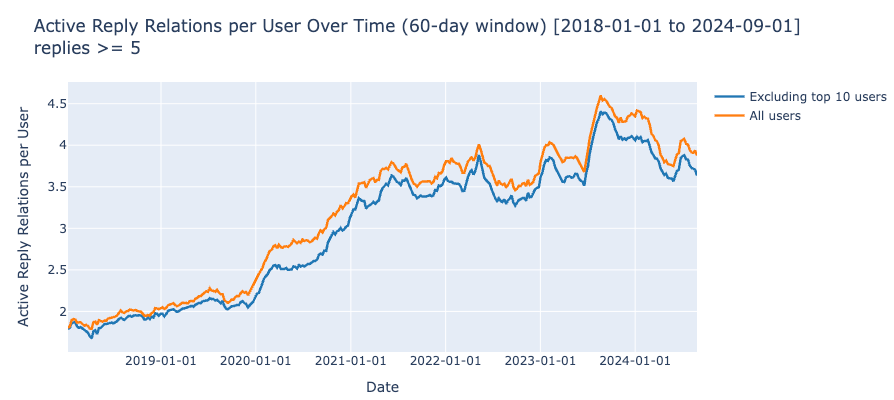
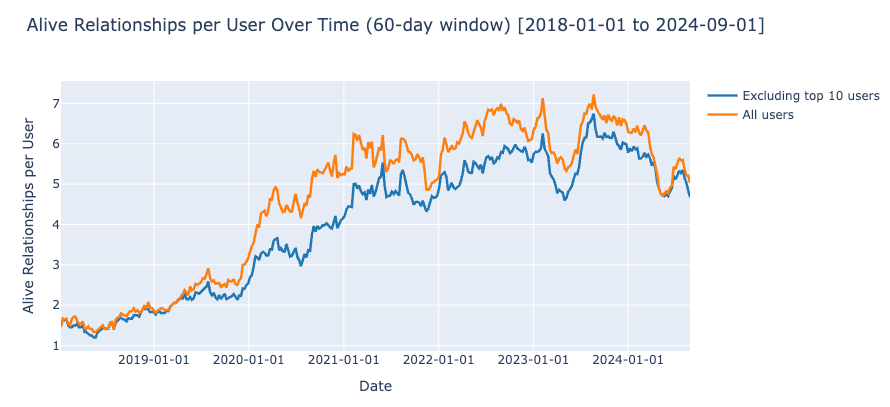
The global trends we commented on (sharp increase after Vibecamp in June 2023, and a dip in 2024) are still visible after we remove the top 10 most social users. This makes us confident that they are community-wide, meaningful patterns.
How do relationships start on Twitter?
LLM summaries of relationship geneses
So far, we looked at aggregated trends of relationships. It is hard to tell from the graphs what makes people reply to each other, and what makes them stop talking. But we could simply read the tweets! Of course, we don’t see DMs or in-person interactions, but for many, new Twitter relations start by playing the threading game in public threads.
We gathered the first tweets exchanged between 1000 user pairs that we selected to have i) the most total replies between the two users, irrespective of the direction (all the relationships have more than 150 interactions), ii) at least one chain of reply that goes A->B->A.
For each pair, we created a file with:
The conversation trees of the first 100 interactions, re-using the tech we built for the strand of narrative builder.
The first 20 A->B->A reply patterns
We sent them to an LLM (oss-120b with medium thinking) to create:
A summary of the genesis of the relationship
A neutral summary (without any username or identifiable keywords)
Tags for how the relationship started and developed, like “in_person_event”, “matchmaker”, “asymmetric_pursuit”, “intellectual_riff”, “playful_banter”, etc.
A score to estimate how much data is missing from the interactions, i.e., a proxy to check if one of the users is undersampled by the CA.
Here are a few curated examples of summaries:
> The connection began when @QiaochuYuan posted a long thread about relationship patterns on May 14, 2019, and @tasshinfogleman replied the next day, asking for more details about a talk mentioned in the thread. From that reply, they started a back‑and‑forth exchange, gradually deepening into discussions about meditation, psychology, and shared projects. Their interaction remained fairly balanced, with both frequently replying and supporting each other’s ideas.
> Malcolm_Ocean posted a tweet about a book on March 29, 2019, and a few days later QiaochuYuan replied directly, asking about the concept. QiaochuYuan’s reply sparked a back‑and‑forth where Malcolm shared drafts, resources and ideas, and QiaochuYuan responded with reflections, jokes and further questions. Their exchange quickly grew into a sustained, mutually‑responsive dialogue covering philosophy, neuroscience and collaborative projects.
> They first met at Vibecamp on June 20, 2023, where @easoncxz joined @univrsw3th4rt and others after being ditched by a friend group. @univrsw3th4rt immediately praised eason’s drumming, sparking a back‑and‑forth that quickly turned into regular banter and support. Their exchanges have remained frequent and light‑hearted, with both parties initiating replies.
And for reference, here is what the neutral summary looks like for the first relationship:
> The connection began when one user posted a detailed thread on relationship patterns, and the other replied the next day asking for more information about a referenced talk. This reply sparked an ongoing back‑and‑forth exchange that gradually deepened into discussions about meditation, psychology, and collaborative projects. Their interaction remained fairly balanced, with both frequently replying and supporting each other’s ideas.
Embedding atlas exploration of geneses
We used OpenAI’s large semantic embeddings on the neutral narrative (to avoid having clusters around frequent keywords like usernames), and visualized them using bird’s eye view.
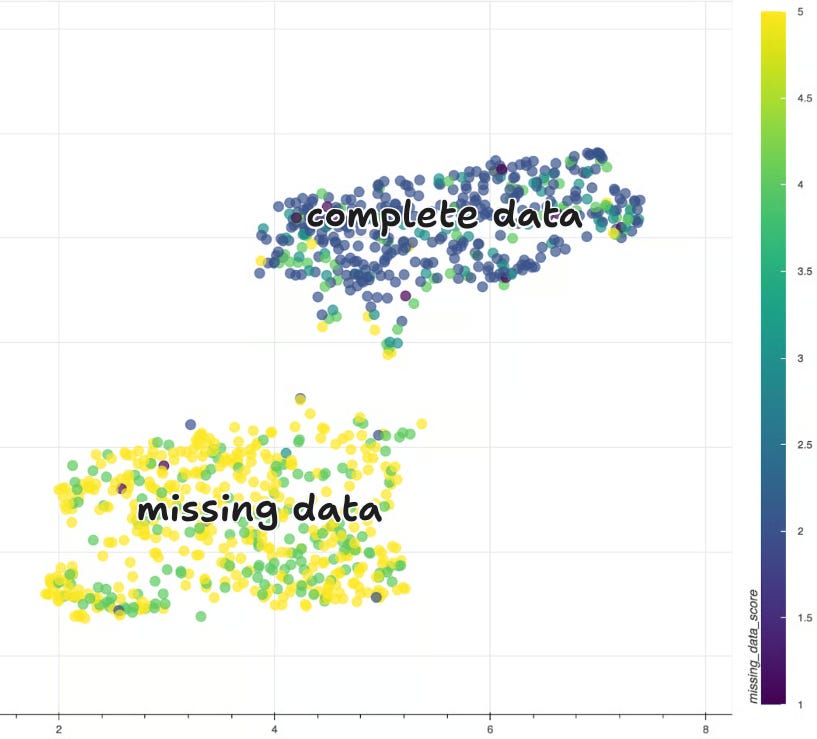
We have two clusters that are clearly separated by the missing data score. The yellow cluster contains the relations where we see mostly one side of the tweets. There has to be at least one response from the other side, as this is how we filter the relationships in the first place. But one tweet from the other side got caught using the recent community archive extension.
To remove the problem of missing data, we only looked at low missing data score relations. This gives us this embedding atlas. You can download the file here to explore by yourself.
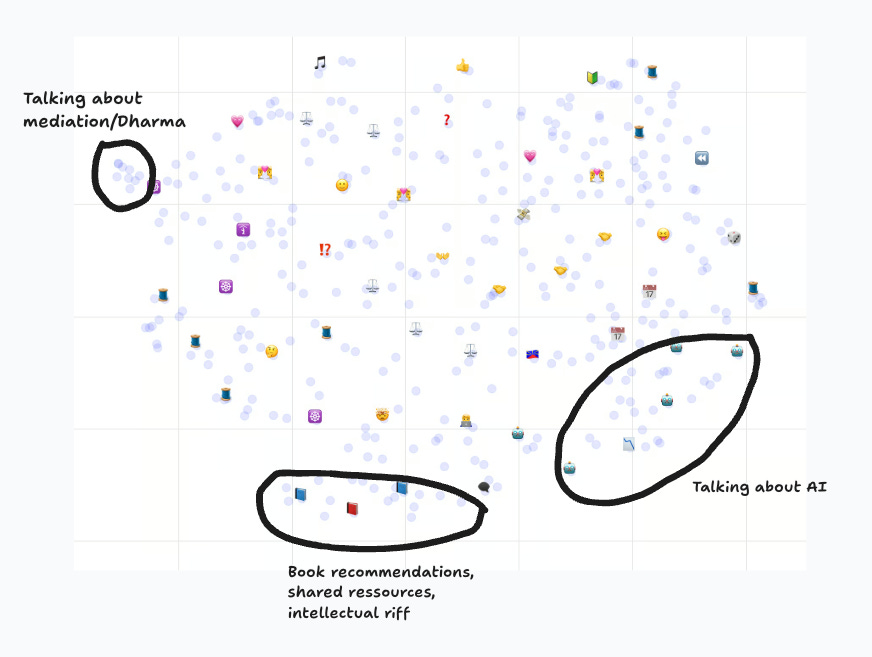
There are a few thematic regions we added to the graph, but it seems generally hard to separate clusters. This is a negative analysis showing there is no clear-cut inherent pattern in how relationships start.
Creating archetypes of relationship genesis stories
To complement the embedding analysis, we asked Claude Opus 4.5 to read all the summaries and write archetypal stories of how relationships start.
At this point, we are reading LLM summaries of LLM summaries, and we start to become quite suspicious. So we went and looked at the raw tweets data behind the representative examples picked by Opus to illustrate each of the archetypes.
We left comments in italics so you can have a more granular interpretation of the summaries. In general, the one-line description is quite accurate and matches the archetype well for the first three archetypes. There was a fourth archetype (10-12% of the relations) describing genesis for which most of the underlying tweet data is missing. This makes some tweets appear as a top-level post that tags someone, when it’s in fact part of a reply chain. We decided to remove it to keep only the most data-backed archetypes.
Another important caveat is that the summaries are very focused on the first interaction, and don’t take into account the next interactions very much.
Archetype 1: Thread Spark ~55-60%. Person A posts substantive content—a thought thread, philosophical observation, personal reflection, or provocative question. Person B encounters it, finds it resonant, and replies with their own take, extension, or question. This reply becomes the seed of an ongoing dialogue. Examples:
mbateman posted a long-form thread about education research → __drewface replied, sparking ongoing exchange
The initial tweet was a short, very compressed distillation of education research.
RichDecibels posted a philosophical prompt about purpose → aleksil79 replied with a thoughtful continuation
aleksil79’s continuation was the first interaction with RichDecibels, got no replies, and a single like.
AskYatharth posted a detailed thread about feelings → Malcolm responded months later, launching sustained dialogue.
That seems correct, though the dialogue happened in other threads than the original one.
visakanv’s prolific threads on mythology, culture, and networking repeatedly drew new responders into conversation
Correct
Archetype 2: Shared Arena ~15-18%. Both users encounter each other through a third-party context—a community challenge, multi-person thread, organized event, or mutual connection’s post. Neither directly initiated contact with the other; the third context drew them into proximity.
chercher_ai’s “Explain Energy” challenge → Brent tagged Daniel in his comment, Daniel responded, and ongoing connection formed
Seems correct
visakanv posted asking Twitter friends to share their city → both strangestloop and nopranablem replied “Austin, TX,” then noticed each other
Correct description, though this was their third A->B->A exchange.
CountJ0ecool replied to a multi-person thread that also mentioned aleksil79, leading to direct exchange.
They first interacted on a long back and forth of 4 users on a thread about AGI in 2021.
Multiple relationships deepened through Vibecamp gatherings, with online continuation after in-person contact
We found evidence of this, 12 summaries explicitly mention Vibecamp.
Archetype 3: Help Gateway ~12-15%. Person A posts a practical question, resource request, or asks for help with something specific. Person B provides assistance. This utilitarian exchange creates a social opening that leads to broader connection.
ElodesNL asked AskYatharth about deep breathing techniques → received advice and invitation to DM, relationship expanded into philosophy and music
That’s a correct description of their very first interaction
PrinceVogel requested classical music recommendations → AngularOcean replied with a suggestion, establishing reply-based connection
AngularOcean’s suggestion got one like and no reply. Their next interaction was two months after.
m_ashcroft asked where to find a self-paced course → uberstuber provided the link, leading to ongoing advice and encouragement exchanges
Correct, m_ashcroft asked for “the Bio-Emotive self-paced course”
tasshinfogleman replied to _brentbaum with a tip about searching Twitter lists → exchange expanded into art, meditation, and community projects
Correct
We think they are pretty good takeaways from the data! It’s not very surprising, but the bulk of the relations simply start as a series of thoughtful replies to each other.
Limitations and next steps
We have so far only looked at the genesis of the relations. It might be more interesting to analyze their full trajectories and spot the inflection points where the relationships tighten.
Technically, we also found the quality of the summaries and tags mixed. From spot-checking, we found instances of in-person events in the early tweets not being mentioned in any summaries, and the tag “in_person” was not applied. We could iterate more on this aspect.
We have been limited by the availability of the data. Exhaustive data about bidirectional relationships can only exist between two members of the community archive (~ 300 accounts). As visible in the analysis of the LLM summaries, we miss the majority of bidirectional relationships that users have, and they often involve one non-CA account.
With MOAR DATA (upload your archive here!), we could do comparative analysis of communities to isolate community-specific events (in-person camp) from platform-wide events (change in algorithm), or aggregate quantitative trends to interpret more subtle trends in the data.
A final exciting direction would be to look at the sharp rise in relationships after Vibecamp 2, and first try to find if this is indeed caused by Vibecamp, and second, see if it is mostly the revival of old relationships inactive for the last few months, or connecting people that never interacted before.
Departing thoughts
We started with the goal of measuring the health of an online community by measuring the activity of its social scene. We think that the relationship metrics we propose here could be one indicator in a diverse portfolio that would also measure signals related to the content of the discourse.
The empirical results are good signs of life, that there are patterns to find in studying how relationships are born and maintained over time on Twitter. Though our data is still limited, to be able to draw confident conclusions or interpret more subtle trends.
The most exciting next step for us is to make them action-relevant, to refine our analysis to help online communities flourish!
Appendix
More plots for the curious.
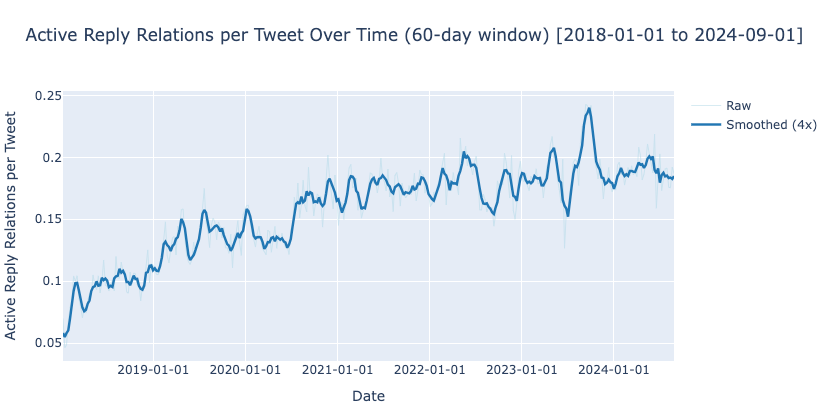
Users counts
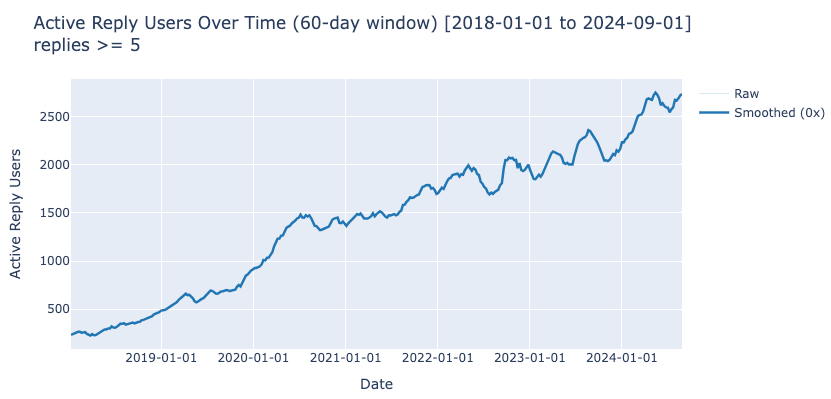
Number of relationships per tweet
 | A guest post by
|